Welcome back! If this is your first visit to VeXation you may want to start by reading about the project, the development environment, the work in progress PE infector virus, or the previous post about delta offsets.
Continued Recap 🔗
At the end of the last post I completed pijector, an updated version of minijector. pijector is a PE executable file infector virus that can add its code to .exe files found in the same directory by adding a new section to the infected target. The injected code is self-contained and position independent.
There are two big shortcomings with pijector that prevent it from being a functional virus. Recall that in generation 1+:
- The way the virus code uses Win32 API functions will not work - a layer of indirection was broken and the first API function call will crash.
- The original entrypoint of the infected program is never called. The host program is effectively broken by the infection.
Today I’ll describe how I worked through solving the Win32 API problems. With that out of the way I’ll be in a good position to describe how I handled the original entrypoint problem in a future post.
Let’s jump right in!
Understanding the problem 🔗
To understand why the Win32 API function invocations in the pijector virus code were broken I started by comparing the execution of generation 0 and generation 1 in a debugger. By carefully stepping through the first win32 function call in the virus code in both generations and comparing the results I was able to build a picture of the problem. (If you already feel comfortable with this you might want to jump ahead).
Generation 0 🔗
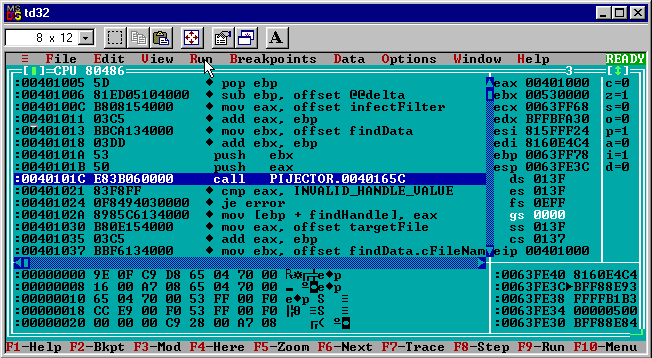
I started by running the generation 0 pijector.exe in td32 and switching to the CPU view.
The first Win32 API function the pijector virus code uses is FindFirstFileA exported from C:\windows\system\kernel32.dll.
In the source code the call looks like:
call FindFirstFileA, eax, ebx
In the disassembly view it looks like:
push ebx
push eax
call PIJECTOR.0040165C
I was expecting that the call target would be a memory address somewhere in the kernel32.dll address space but the disassembly view shows a target inside of pijector’s address space: PIJECTOR.0040165C. Already the debugger is challenging my assumptions!
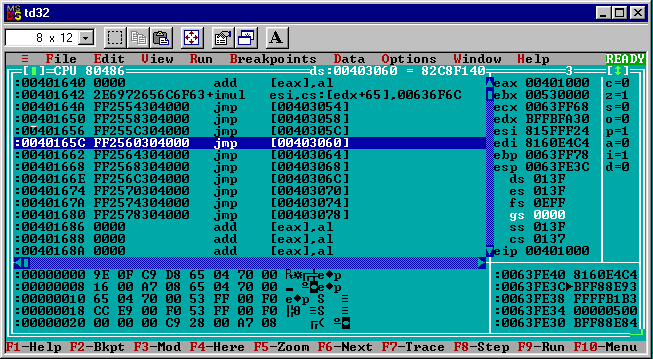
Seeing a call to an unknown address the first question I have is “what code is at 0x0040165C”? One way to check that in td32 is to “follow” the call by right clicking the line and choosing “Follow”.
Now td32 shows:
jmp [00403060]
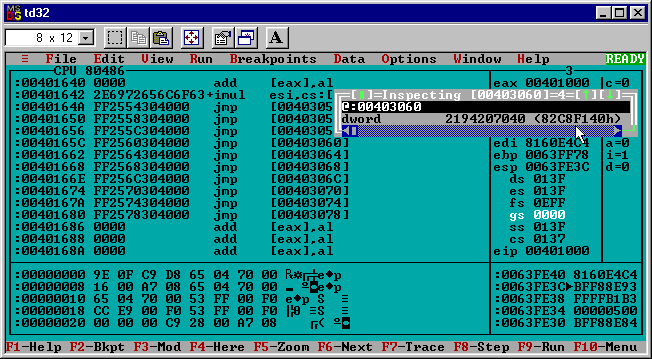
So the call takes the debugger to a jmp instruction to the address specified at 0x00403060. Choosing “Data” in the td32 menu followed by “Inspect” pops up a window that I used to quickly peek at what address the jmp will go to before following it.
Entering [00403060] as the expression (just like in the disassembly) shows the dword hex value:
0x82C8F140
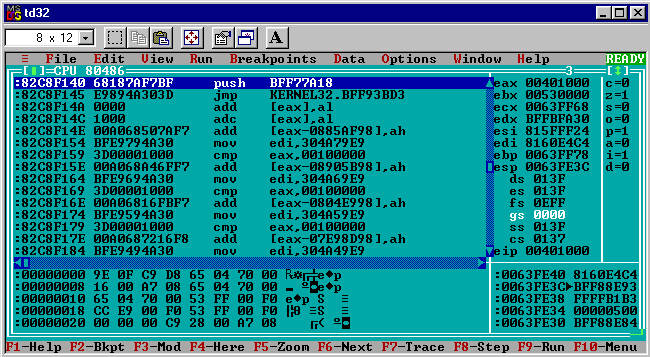
That looks more like what I was expecting initially: an address in kernel32.dll. Following the jmp [00403060] instruction confirms the debugger does end up in the kernel32.dll address space.
Now the disassembly shows:
push BFF77A18
jmp KERNEL32.BFF93BD3
Very interesting! It’s already pretty clear that there is some indirection between the virus code’s calls to Win32 APIs and how control eventually ends up in the kernel32.dll address space.
Some of the addresses from this debugging experiment make more sense when compared with tdump output of both pijector and kernel32.dll.
First, the jmp [00403060] instruction is interesting because the tdump of pijector shows that 0x00403060 is in the .idata section.
Object table:
#   Name      VirtSize    RVA     PhysSize  Phys off  Flags
--  --------  --------  --------  --------  --------  --------
01  CODE      00001000  00001000  00000800  00000600  60000020 [CER]
02  DATA      00001000  00002000  00000000  00000E00  C0000040 [IRW]
03  .idata    00001000  00003000  00000200  00000E00  C0000040 [IRW]
04  .reloc    00001000  00004000  00000200  00001000  50000040 [ISR]
I could tell this quickly because subtracting the base address of pijector.exe (0x00400000) from the address in the jmp reference (0x00403060) gives 0x00003060. Since 0x00003060 is larger than 0x00003000 (which is the RVA of the .idata section) and smaller than 0x00004000 (which is the RVA of the .reloc section) the pointer that’s used for the jmp target must be in .idata.
The push BFF77A18 instruction that jmp [00403060] brings execution to is interesting when matched up to a tdump of C:\windows\sytem\kernel32.dll. (Isn’t it handy that tdump works with .dlls too?)
In my kernel32.dll’s exports the FindFirstFileA function appears like so:
0249 00007a18 FindFirstFileA
It has ordinal number 249 and the RVA 0x00007a18. Adding the kernel32.dll base address 0xBFF70000 (more on finding that later) to the FindFirstFileA RVA gives 0xBFF77A18 - the argument from the push instruction!
What does it all mean? In summary:
- First,
call FindFirstFileAin generation 0 doesn’t immediately call intokernel32.dllcode. - Instead, it calls a local address that
jmps to a memory address specified in a pointer in the.idatasection - Finally, the
jmptakes execution intokernel32.dllwhere the exportedFindFirstFileAfunction address gets pushed.
(note: Some of the above is specific to tasm32/tlink32 but in general it works similarly for other assemblers/linkers).
Why so much indirection? One reason is that it lets the operating system loader populate the .idata section with pointers to imported kernel32.dll functions without having to update each individual call site in the code section(s).
(note: For a more rigorous explanation of these mechanisms see the “Peering inside the PE” MSDN article, particularly “PE file Imports” and “PE File Exports”).
Now that I had seen how the API function invocation works in generation 0 it was time to turn to the generation 1 code that crashes. Ignoring any other resources it’s possible to start to see the problem based on what’s known from stepping through generation 0.
The indirection I observed relied on pointers in an .idata section but the virus code only creates one new .ireloc section in the target. Nothing carries forward or corrects for the missing .idata pointers. I used the same process of following an API call in td32 with the generation 1 calc.exe to verify that idea.
Generation 1 🔗
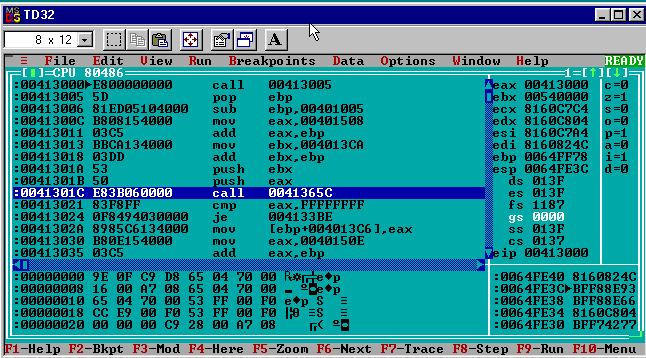
Loading the infected generation 1 calc.exe in td32 I saw the call FindFirstFileA Win32 API function call in the virus code a few instructions from the top, after the delta offset calculation. Similar to the Generation 0 disassembly the function call is a call to a memory address inside of calc.exe’s address space.
In generation 0 the disassembly was:
call PIJECTOR.0040165C
In generation 1 the disassembly is:
call 0x0041365C
The difference in address (0x0040165C vs 0x0041365C) is explained by the location of the code. In both cases the call’s relative target was 0x0000065C but the location of the call itself differed.
In generation 0 the executable’s base address was 0x00400000 and the CODE section’s RVA was 0x00001000. If I add the base address, the section RVA, and the relative target I get the generation 0 call target: 0x00400000 + 0x00001000 + 0x0000065C = 0x0040165C.
In generation 1 the executable’s base address was still 0x00400000 but the .ireloc section that the call instruction is in has an RVA of 0x00013000. If I add the base address, the section RVA, and the relative target again I get the generation 1 call target: 0x00400000 + 0x00013000 + 0x0000065C = 0x0041365C.
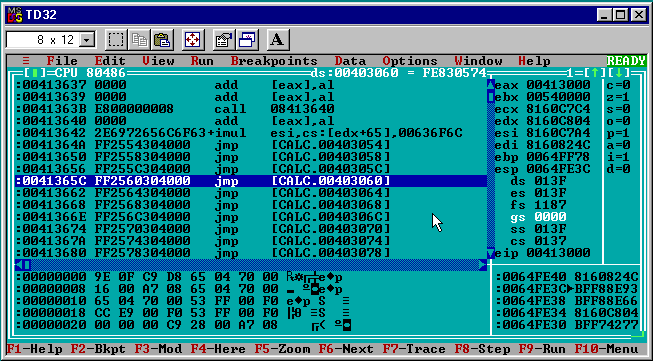
So far execution has looked the same. Moving on to following the call will answer the question “What code is at 0x0041365C in calc.exe?”.
The disassembly shows a jmp instruction and its target ([CALC.00403060]) looks the same as in generation 0. So far so good.
jmp [CALC.00403060]
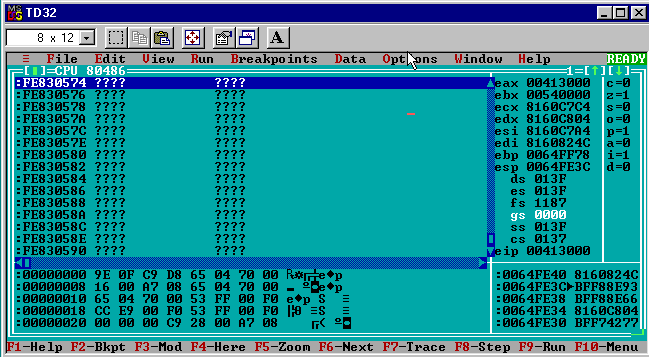
Using the data inspector window again the address at [00403060] for the jmp target can be checked:
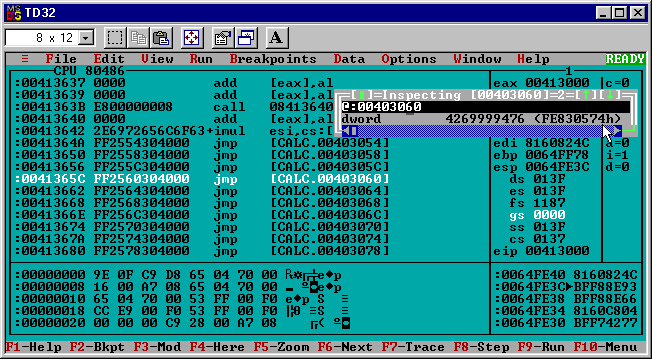
This time it shows a DWORD with the hex value:
0xFE830574
This address looks totally wrong and it isn’t the same target that Generation 0 jumped to. A smoking gun!
Letting the debugger follow the jmp [CALC.00403060] instruction sends it to la-la land.
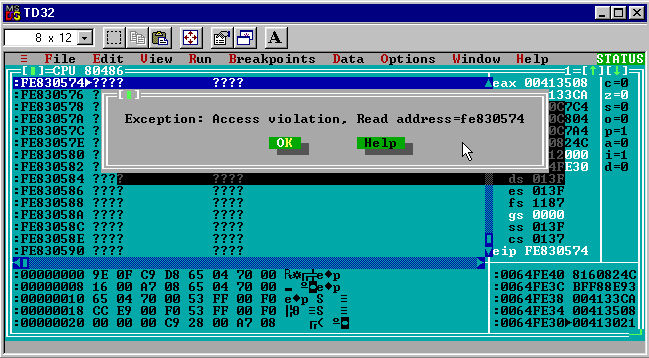
Ultimately the jmp causes an access violation and calc.exe crashes shortly after.
What to do? 🔗
It’s clear the indirection used by generation 0 is a problem in generation 1+. The target of the jmp in the indirected kernel32.dll API call is read from an address that only made sense in generation 0. Similar to the problem of variable references across multiple sections that I tacked in the delta offsets post the easiest solution is one of simplification: stop using the system loader to resolve kernel32.dll function references and stop relying on pointers in the .idata section.
Hard-coding 🔗
The earliest win32 viruses avoided the system loader by hard-coding the addresses of the exported DLL functions they used. Imagine if instead of using call FindFirstFileA the pijector code instead used call 0xBFF77A18. As long as the kernel32.dll export for FindFirstFileA was always at RVA 0x00007A18 and kernel32.dll was always loaded at 0xBFF70000 this would be smooth sailing. Of course in practice all of these things change. Even differences as inconsequential seeming as the configured system locale can result in breaking hard-coded addresses.
DIY 🔗
Another way to approach this problem (and the route I chose) is to have the virus code act like its own little linker/loader and find the addresses of the DLL functions required at runtime. This turns out to be a fun way to get some hands on experience playing with concepts from dynamic linking and operating system loaders.
In Windows dynamic linking is the domain of Dynamic Link Libraries (.dlls). The best part is that DLLs are implemented as PE executables! Having already written x86 ASM for manipulating PE metadata it’s straight-forward to get right into working with the kernel32 DLL. That’s also the reason that the trusty tdump tool has no problem with DLLs.
There’s one other handy Windows trick that the virus code can use to do its runtime linking of external DLL functions: kernel32.GetProcAddress. This is an exported function from kernel32.dll that finds the address of any exported DLL function given its name and the DLL’s base address.
The GetProcAddress function presents a nice short-cut. All the virus has to do is somehow find kernel32.dll and the address of the GetProcAddress function and from there it’s easy to find any other required API addresses in a way that won’t rely on the .idata section or any hard-coded offsets.
Exploring the solution 🔗
Since the task of finding win32 API function addresses from kernel32.dll at runtime is fairly self-contained I decided to start by experimenting with a stand-alone program separate from the PE infector virus code. Once I had a good solution I integrated it back into the virus code.
I decided to call the standalone program apifind since that’s what it was going to do. At a high level the apifind code:
- Finds
kernel32.dll’s base address - Finds
kernel32.dll’sIMAGE_EXPORT_DIRECTORYstructure - Finds the index of
GetProcAddressinIMAGE_EXPORT_DIRECTORY.AddressOfNames - Uses the index to find the
GetProcAddressordinal inIMAGE_EXPORT_DIRECTORY.AddressOfNameOrdinals. - Uses the ordinal of
GetProcAddressto find the export RVA inIMAGE_EXPORT_DIRECTORY.AddressOfFunctions - Uses the discovered RVA of
GetProcAddressto find other required APIs (e.g.kernel32.FindFirstFileA).
The complete assembly code for apifind is available in the VeXation Github repo.
Where’s kernel32.dll? 🔗
The first thing apifind needs to do is find the base address where kernel32.dll is loaded.
If you’re familiar with more modern (e.g. Windows 2000/NT+) malware you might know of a trick for this based on chasing pointers from the Process Environment Block (PEB) to a list of loaded modules. On Windows 2000/NT/XP kernel32.dll’s location in the module list was predictable and so offered a reliable way to find the base address dynamically. Since I’m targeting Windows 95 it’s totally not applicable and another approach needs to be taken.
The “trick” I used instead is an even older one. The first reference I saw was in 29A issue 04 from 1999 and an article by “LethalMind” called “RETRIEVING API’S ADRESSES” (sic). I suspect the trick predates this article as well. (Can you even call it a “trick”? On some level it’s just “The Way Things Work”).
The core idea is to take advantage of the fact that it’s kernel32.dll that calls every program’s entrypoint when it’s first started by the operating system. More specifically it’s the kernel32.dll’s CreateProcess function that calls the program’s entrypoint. Since the virus code replaces the infected program’s original entrypoint I know that at the start of the virus code’s execution the return address on the top of the stack will be pointing back into kernel32.dll somewhere.
@@findkernel32:
  ; Put the dword value from the top of the stack into esi. This is the return
  ; address for the kernel32.CreateProcess function call one frame above us and
  ; points somewhere in kernel32.dll.
  mov esi, dword ptr [esp]
Since kernel32.dll is a DLL and DLLs are portable executables I know what the start of kernel32.dll will look like: It should have a DOS header with the magic MZ bytes. Further, I know it will be section aligned in memory. All of that PE knowledge from previous posts keeps coming in handy!
Using the return address from the stack the virus code can search backwards by the size of a section, looking for the DOS header magic bytes. When it finds a section aligned address that has the expected header it will be the base address of kernel32.dll.
| |
One disadvantage of this technique is that it only works if the virus code is executed before the host program code. If the real program is run first then the state of the stack will be unpredictable. I might have to revisit this strategy in the future if I mess around with more sophisticated entrypoint obfuscation but for now it will work reliably.
DLL Exports 🔗
Knowing the base address of where kernel32.dll is loaded lets me move on to apifind’s next challenge: finding the GetProcAddress function export in kernel32.dll.
The PE format is responsible for describing how a DLL exports a function for consumption by another program. The “Peering inside PE” article’s section on “PE File Exports” was an invaluable resource for understanding PE exports.
To summarize, kernel32.dll has an IMAGE_EXPORT_DIRECTORY structure that is predictably located (it’s always the first data directory after the section table of the PE structure). Inside of the IMAGE_EXPORT_DIRECTORY structure are pointers to three arrays:
AddressOfFunctions- which holds pointers to the RVA of each exported DLL function.AddressOfNames- which holds pointers to the null terminated name of each exported DLL function.AddressOfNameOrdinals- which holds the ordinal (basically an ID number) of each exported DLL function.
All three arrays have the same number of entries and can be accessed in parallel. That is, if I can find the index of a specific function name in AddressOfNames I can use that index to find the ordinal in AddressOfNameOrdinals and then the function pointer in AddressOfFunctions using the ordinal.
The x86 assembly that accomplishes the above is a little bit gnarly but I did my best to comment it thoroughly. At a high level the code:
- Finds the
kernel32.dllIMAGE_EXPORT_DIRECTORYstructure. - Loops through
AddressOfNamesto find the entry matching"GetProcAddress\0" - Uses the matching offset in
AddressOfNamesto find the ordinal forGetProcAddressinAddressOfNameOrdinals - Uses the ordinal for
GetProcAddressto find the memory address of the exported function inAddressOfFunctions.
Once the address of the GetProcAddress function from kernel32.dll is known the fun can really begin.
Link it yourself 🔗
The virus code from pijector uses a handful of kernel32.dll functions (FindFirstFileA, FindNextFileA, lstrcpy, CreateFileA, etc). Using GetProcAddress makes for an easy way to find the address of each without needing to do as much work spelunking the kernel32.dll export table.
To find the address of FindFirstFileA the apifind.asm code uses the discovered GetProcAddress address (held in a var GetProcAddress):
| |
For every function the virus wants to “link” it needs two things:
- The name of the API in a null terminated string (e.g.
szFindFirstFileAabove holds"FindFirstFileA\0"). - A four byte var to hold the function pointer (e.g.
FindFirstFileAabove)
I chose the most naive solution for the first part and included the literal strings in the virus code. That’s an obvious tell for AV since the virus code will now have function name strings like "GetProcAddress\0" and "FindFirstFileA\0" embedded in each infected file that aren’t present in the file’s PE imports. There are lots of various tricks for working around this but for now I’m ignoring AV “stealth”.
One of the other challenges I encountered was finding a way to use raw function pointers with TASM while still having it handle the stdcall calling convention and argument checking. The solution to this was adding explicit PROCDESC types to reference for each call of a raw pointer.
You might notice that weird call syntax in the fragment above. It relies on a procGetProcAddress PROCDESC. In brief PROCDESC is a bit of TASM syntax that lets me give the assembler a description of the function I’m calling so it can use the correct calling convention and check the arguments. For GetProcAddress the procGetProcAddress PROCDESC looks like:
procGetProcAddress PROCDESC stdcall baseAddr:DWORD,name:DWORD
It indicates that the stdcall calling convention should be used and there are two DWORD arguments: the base address of a DLL and a pointer to the name of the exported function to lookup.
The apifind.asm code uses a similar PROCDESC to invoke the kernel32.FindFirstFileA function by the address found with GetProcAddress:
| |
End-to-end this is certainly more verbose than the simple call <api> that normal programs can get away with but virus code is “special” ;-D
Convenient Macros 🔗
Tackling the clunkyness was my next task. I decided it made sense to write some quick macros that would make it easier to find required API addresses and invoke them. Borland Turbo Assembler’s Macro language is pretty powerful and I was able to get decent results quickly, even as a complete assembly language programming novice.
To make it easy to see how the macros replaced the initial code I made a separate apifind2 project that took the code from apifind1 and introduced the new macros.
I created four macros, each addressing one of the four parts involved in the process of using an exported DLL function resolved by the virus at runtime:
- Making a name variable and a pointer variable for each API.
- Describing the API procedure and its arguments.
- Populating the pointer variable by finding the name.
- Invoking the described procedure using the pointer.
REQUIRED_API 🔗
The macro I wrote for declaring a name variable and a pointer variable for each API is called REQUIRED_API:
| |
DESC_RUNTIME_API 🔗
The macro I wrote for generating a PROCDESC for each API is called DESC_RUNTIME_API:
| |
LINK_API 🔗
The macro I wrote to find the kernel32.dll function address for a REQUIRED_API is called LINK_API:
| |
CALL_RUNTIME_API 🔗
The last macro is the one used to invoke functions previously described with DESC_RUNTIME_API and declared with REQUIRED_API. The LINK_API macro uses CALL_RUNTIME_API to call GetProcAddress.
| |
Next Steps 🔗
With apifind and apifind2 I have an effective way to find kernel32.dll and its exported functions at runtime without hard-coding anything. The next step is to take this code and integrate it back into the pijector virus code.
For this I created a project called apisafejector. Like the other projects so far its code is available in the VeXation repo.
I was able to use the code/macros from apifind2 for apisafejector as-is with one small exception: all of the variable references needed to be adjusted to use the delta offset.
For each of the Win32 APIs used by pijector the apisafejector code needed:
- a
DESC_RUNTIME_APIline. Seeapisafejector.incfor these. - a
REQUIRED_APIline. See the bottom ofapisafejector.asmfor these. - a
LINK_APIline. See the@@linkapislabel inapisafejector.asm.
After these three pieces were in place I updated each of the existing call <win32 api function>, <args> instructions to use CALL_RUNTIME_API <win32 api function>, <args> instead.
A virus at last! 🔗
It’s finally time to see if the virus code can propagate itself beyond the first generation. To test the updated apisafejector virus I started by infecting calc.exe by using the Makefile’s run target with a clean build (without debug symbols):
make clean
make
make run
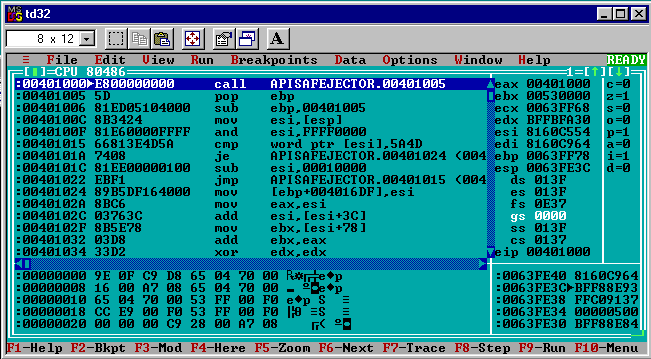
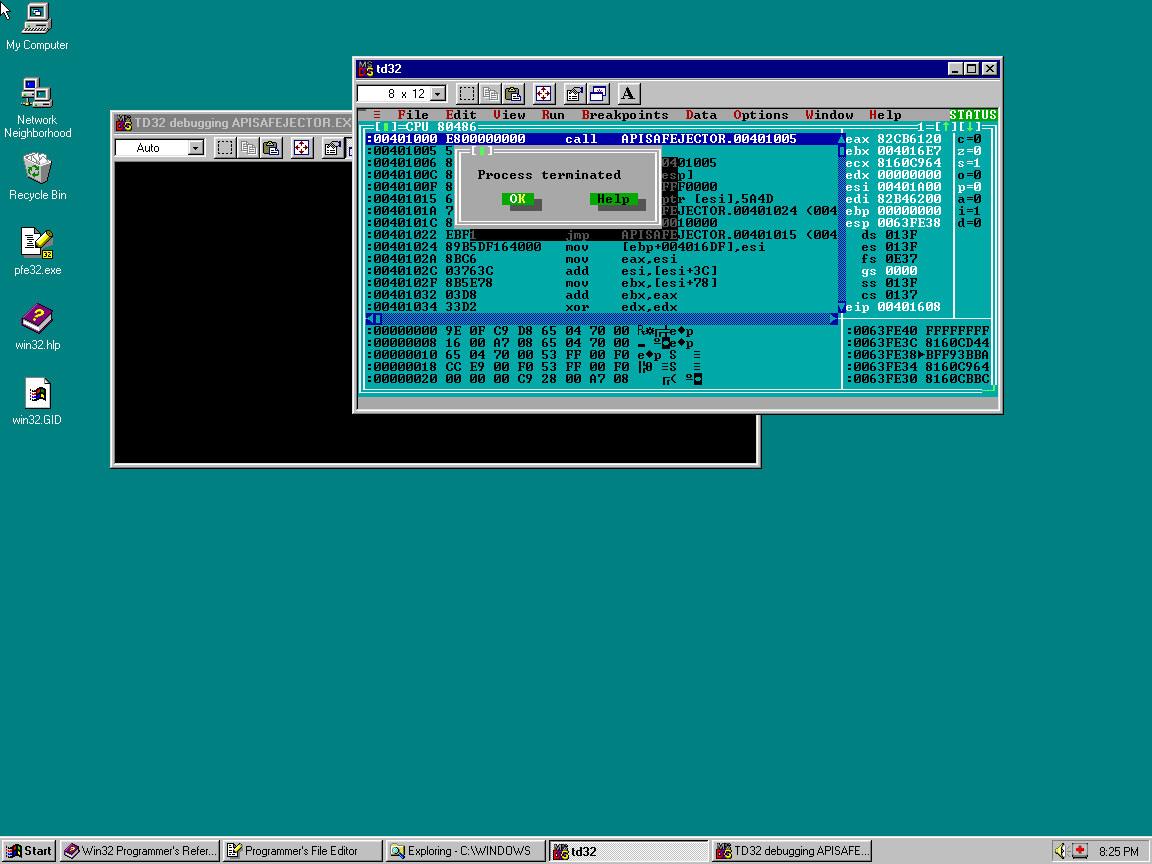
This launched apisafejector.exe in td32 (remember it’s a necessary hack to run the generation 0 executable this way or it will crash writing to a read-only section). Hitting F9 lets it complete its work infecting the only other .exe in the directory that can be opened for writing, calc.exe. The apisafejector.exe process terminates normally once it was complete.
I verified calc.exe was infected by checking the tdump calc.exe output to see that the entrypoint was updated and that there was a new .ireloc section added.
Before tdump calc.exe showed:
Entry RVA                0000534E

Object table:
#   Name      VirtSize    RVA     PhysSize  Phys off  Flags
--  --------  --------  --------  --------  --------  --------
01  .text     000096B0  00001000  00009800  00000400  60000020 [CER]
02  .bss      0000094C  0000B000  00000000  00000000  C0000080 [URW]
03  .data     00001700  0000C000  00001800  00009C00  C0000040 [IRW]
04  .idata    00000B64  0000E000  00000C00  0000B400  40000040 [IR]
05  .rsrc     000015CC  0000F000  00001600  0000C000  40000040 [IR]
06  .reloc    00001040  00011000  00001200  0000D600  42000040 [IDR]
After:
Entry RVA                00013000

Object table:
#   Name      VirtSize    RVA     PhysSize  Phys off  Flags
--  --------  --------  --------  --------  --------  --------
01  .text     000096B0  00001000  00009800  00000400  60000020 [CER]
02  .bss      0000094C  0000B000  00000000  00000000  C0000080 [URW]
03  .data     00001700  0000C000  00001800  00009C00  C0000040 [IRW]
04  .idata    00000B64  0000E000  00000C00  0000B400  40000040 [IR]
05  .rsrc     000015CC  0000F000  00001600  0000C000  40000040 [IR]
06  .reloc    00001040  00011000  00001200  0000D600  42000040 [IDR]
07  .ireloc   00001000  00013000  00000A00  0000E800  E0000020 [CERW]
Since the virus only infects *.exe files in the same directory it’s easy to make a little test lab to see if the first generation calc.exe infection is working. I simply made a new directory, copied in the infected calc.exe and then copied in a clean cdplayer.exe from the Windows directory.
mkdir test
cd test
copy ..\calc.exe
copy c:\windows\cdplayer.exe
Running calc.exe in this directory appears to do nothing: since the virus code doesn’t call the original calc.exe entrypoint yet the program immediately exits after infecting cdplayer.exe and without showing any actual calculator GUI.
Checking the tdump output from cdplayer.exe shows that while it seemed like calc.exe exited without doing anything the infection did work! The entrypoint of cdplayer.exe was changed and a new .ireloc section was added. The generation 1 calc.exe managed to successfully create a generation 2 infection in cdplayer.exe!
Before running the infected calc.exe tdump cdplayer.exe showed:
Entry RVA                0000DE00

Object table:
#   Name      VirtSize    RVA     PhysSize  Phys off  Flags
--  --------  --------  --------  --------  --------  --------
01  .text     0000CFC0  00001000  0000D000  00000400  60000020 [CER]
02  .sdata    00000004  0000E000  00000200  0000D400  D0000040 [ISRW]
03  .data     00000C10  0000F000  00000E00  0000D600  C0000040 [IRW]
04  .idata    0000135C  00010000  00001400  0000E400  40000040 [IR]
05  .CRT      00000014  00012000  00000200  0000F800  C0000040 [IRW]
06  .rsrc     00004618  00013000  00004800  0000FA00  40000040 [IR]
07  .reloc    000014F4  00018000  00001600  00014200  42000040 [IDR]
After it showed:
Entry RVA                0001A000

Object table:
#   Name      VirtSize    RVA     PhysSize  Phys off  Flags
--  --------  --------  --------  --------  --------  --------
01  .text     0000CFC0  00001000  0000D000  00000400  60000020 [CER]
02  .sdata    00000004  0000E000  00000200  0000D400  D0000040 [ISRW]
03  .data     00000C10  0000F000  00000E00  0000D600  C0000040 [IRW]
04  .idata    0000135C  00010000  00001400  0000E400  40000040 [IR]
05  .CRT      00000014  00012000  00000200  0000F800  C0000040 [IRW]
06  .rsrc     00004618  00013000  00004800  0000FA00  40000040 [IR]
07  .reloc    000014F4  00018000  00001600  00014200  42000040 [IDR]
08  .ireloc   00001000  0001A000  00000A00  00015800  E0000020 [CERW]
To ensure this wasn’t a fluke I tried making one more test directory to see if the generation 2 infection in cdplayer.exe could propagate.
mkdir test2
cd test2
copy ..\cdplayer.exe
copy c:\windows\pbrush.exe
Running the infected cdplayer.exe gave the same results as calc.exe. The program exited immediately and the tdump output for the pbrush.exe program shows the tell-tale signs of infection. Generation 2 successfully propagated to generation 3 in pbrush.exe!
Before running cdplayer.exe tdump pbrush.exe showed:
Entry RVA                0000100C

Object table:
#   Name      VirtSize    RVA     PhysSize  Phys off  Flags
--  --------  --------  --------  --------  --------  --------
01  .text     000000AB  00001000  00000200  00000400  60000020 [CER]
02  .idata    000000E4  00002000  00000200  00000600  40000040 [IR]
03  .rsrc     0000071C  00003000  00000800  00000800  40000040 [IR]
04  .reloc    00000034  00004000  00000200  00001000  42000040 [IDR]
After it showed:
Entry RVA                00005000

Object table:
#   Name      VirtSize    RVA     PhysSize  Phys off  Flags
--  --------  --------  --------  --------  --------  --------
01  .text     000000AB  00001000  00000200  00000400  60000020 [CER]
02  .idata    000000E4  00002000  00000200  00000600  40000040 [IR]
03  .rsrc     0000071C  00003000  00000800  00000800  40000040 [IR]
04  .reloc    00000034  00004000  00000200  00001000  42000040 [IDR]
05  .ireloc   00001000  00005000  00000A00  00001200  E0000020 [CERW]
I have to admit I took particular joy in corrupting my favourite Windows utilities one by one.
Conclusion 🔗
With apisafejector I’ve arrived at a from-scratch Borland Turbo Assembler PE infector virus that actually propagates itself. The last remaining challenge before a rough prototype of the core virus is complete is finding a way to invoke the infected program’s original code. If all of the infected programs appear to be broken then the virus certainly won’t evade detection for long.
I hope presenting my progress and general piece-wise development approach is interesting! I’ve only scratched the surface of what’s possible and implemented the most basic techniques to keep making forward progress. I’m excited to gradually improve on the skeleton established so far. If nothing else this project has emphasized for me the difference between knowing how to do something in theory and actually doing it in practice :-)
In general it seems like I manage ~one post a month so I hope to see you in May for the next VeXation installment. As always, I would love to hear feedback about this project. Feel free to drop me a line on twitter (@cpu) or by email (daniel@binaryparadox.net).
